

Retrospective
Daily standups
Planning poker
Tools
Icebreaker Add-on
Metrics
Hill Charts
AI-Assist
Agility Cards
Integrations





 Pricing
Login
Get StartedStart
Pricing
Login
Get StartedStart
Uphill is thinking.
Downhill is doing.
A percentage cannot tell those apart.
A hill chart shows you at a glance.
Every task is a dot, and the hill tells you what kind of work is left
Drag each task to where it honestly sits. On the way up, you are still discovering what the work involves. Once it crests, the unknowns are settled and only the doing is left. Where a dot sits says more than any number could.
How to read one, in thirty seconds
Climbing the left side
The task is still being worked out. Nobody can estimate it honestly yet, because the unknowns have not been found.
Over the top
The approach is settled. What is left is execution, and now an estimate actually means something.
Not moving
A dot that sits still for a week is the most useful signal on the board. That is the conversation to have.
Two tasks at "50%" can be nothing alike
One is halfway up the hill with the hardest questions still open. The other is halfway down with a clear run to the finish. On a status report they look identical. On a hill chart, nobody has to ask.
Update it together, once, with a note
Drag the dots while you talk through the board, then record the whole thing as a single check-in. Nothing saves until you do, so the history stays a record of real conversations rather than a log of every stray drag. When the project is done, play the history back and watch how the work actually moved.
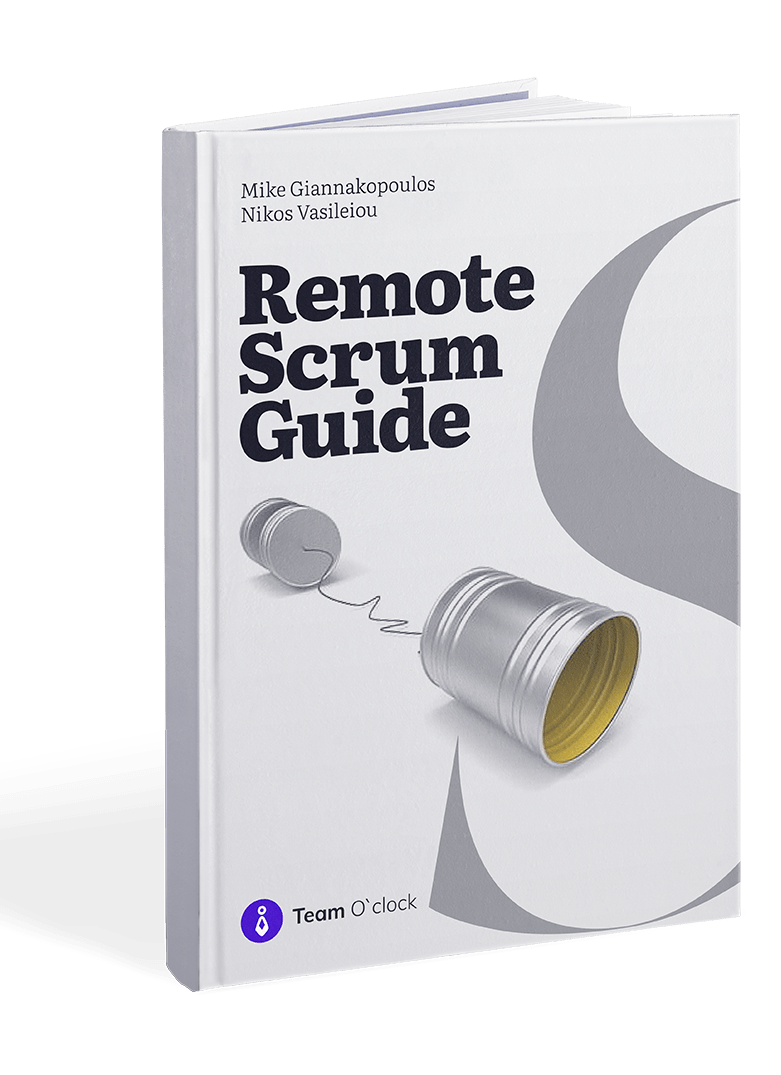
Working with Scrum on a remote setting?
Checkout our free book on Remote Scrum, based on experiences of our customers and ourselves.
Read on how to perform Retrospective, Daily Scrum, and Backlog Refinement rituals with remote teams.
Read more